.png)
Compounding Returns Calculator
Compounding returns is the foundation of long-term wealth building. When you invest money, you earn returns not just on your initial investment, but also on the returns that investment generates. Over time, this compounding effect can transform modest regular contributions into substantial wealth.
This calculator demonstrates the basic mathematics of compound growth. Enter your starting amount, regular contributions, expected return rate, and time horizon to see how your wealth might grow over time.
Understanding the Limitations of This Calculator
While this calculator effectively demonstrates the power of compound interest, it's important to understand what it doesn't account for:
Constant Returns Assumption
This calculator assumes your portfolio earns the same return every single year. Real markets are volatile—you might earn 15% one year and lose 8% the next. This "sequence of returns" matters enormously, especially during retirement.
No Tax Consideration
Different account types (401(k), Roth IRA, taxable brokerage) have dramatically different tax treatments. Tax-loss harvesting, capital gains management, and withdrawal sequencing can add substantial value over decades.
Single Asset Class
This calculator treats your portfolio as a single investment with one return rate. Real portfolios contain multiple asset classes (stocks, bonds, real estate, alternatives) with different risk/return profiles that need to be rebalanced strategically.
No Risk Management
The calculator shows a smooth growth curve, but it doesn't show the distribution of possible outcomes. Understanding the probability of different scenarios is crucial for proper financial planning.
How Professional Portfolio Analysis Works
At River Rose Financial, we use institutional-grade analytical tools that go far beyond simple compound interest calculations:
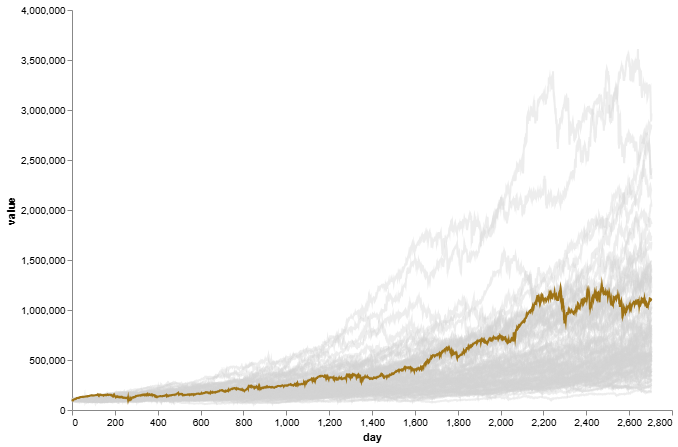
Monte Carlo Simulation
Rather than assuming a constant return, we model thousands of possible market scenarios based on historical return distributions and volatility. This shows the range of probable outcomes—not just a single optimistic line—allowing us to quantify the probability of meeting your goals.
Tax-Optimized Withdrawal Strategies
We analyze which accounts to draw from in which order, when to execute Roth conversions, and how to harvest losses strategically. Over a 30-year retirement, proper tax management can preserve hundreds of thousands of dollars in wealth.
Dynamic Asset Allocation
Portfolio construction isn't about picking the highest returning asset. It's about understanding the correlation structure between asset classes, optimizing for risk-adjusted returns, and implementing systematic rebalancing rules that maintain your target risk exposure.
Quantitative Risk Management
We continuously monitor portfolio risk metrics including volatility, maximum drawdown, Sharpe ratios, and tail risk exposure. Machine learning models help identify regime changes in market conditions, allowing for data-driven adjustments to positioning.
Want Analysis for Your Actual Portfolio?
The tools we use for client portfolios incorporate your specific tax situation, risk tolerance, time horizon, and goals to provide personalized analysis. If you're interested in seeing what comprehensive portfolio analysis looks like for your situation, we'd be happy to discuss how we can help. info@riverrosefinancial.com
Disclaimer: This calculator is for educational purposes only and does not constitute investment advice. Past performance does not guarantee future results. All investing involves risk, including the possible loss of principal.
Ready to Get Started?
Explore our research dashboards covering the economic, fixed income, and equity market data River Rose Financial follows.
Explore Research Tools