
Quantitative Market Research and Intelligence
Comprehensive research tools and economic data visualizations. These analytical frameworks inform our investment decision-making process and portfolio construction methodology.
⚖️ GDP Growth
Track how fast the U.S. economy is actually growing. Compare real versus nominal GDP and quarterly growth rates to gauge the health of the broader economy.
Explore growth trends →
🏛️ Government Finances
Track federal debt, the annual deficit, and revenues. See debt and interest costs measured against government revenue.
Explore fiscal trends →
🌎 Central Bank & Debt Markets
See who actually finances the federal debt — the Fed's balance sheet, foreign holdings of Treasuries, and the trade flows tied to it.
Explore debt markets →
💳 Private Sector Debt
Track household and corporate leverage — debt service, delinquencies, and consumer credit — alongside how that risk is priced in credit markets.
Explore private debt →
📊 Inflation Tracker
Compare consumer price pressures (CPI) against the Fed's preferred measure (PCE). Track headline, core, and producer price trends across timeframes.
Inflation data →
👷♀️ Employment Data
Analyze current employment trends to see how they are affecting the macroeconomic landscape. Compare by history, age, gender, average duration and much more.
Employment data →
📈 Yield Curves
Analyze current and historical Treasury yield curves. Visualize term structures, track spreads, and understand market pricing of future expectations.
Yield Curves →
💳 Credit Spreads
Monitor risk appetite across investment grade and high yield bonds. Track spread widening, tightening cycles, and credit conditions relative to Treasuries.
Analyze credit markets →
🏦 Sector Analysis
Visualize sector performance across various indexed timeframes. Identify trends and compare sector returns and volume changes to inform investment decisions.
Sector Analysis →
💵 Valuations
Visualize current corporate valuation metrics. Filter by sector for accurate comparisons and highlight specific companies of interest.
Explore Valuations →
Professional Research Tools
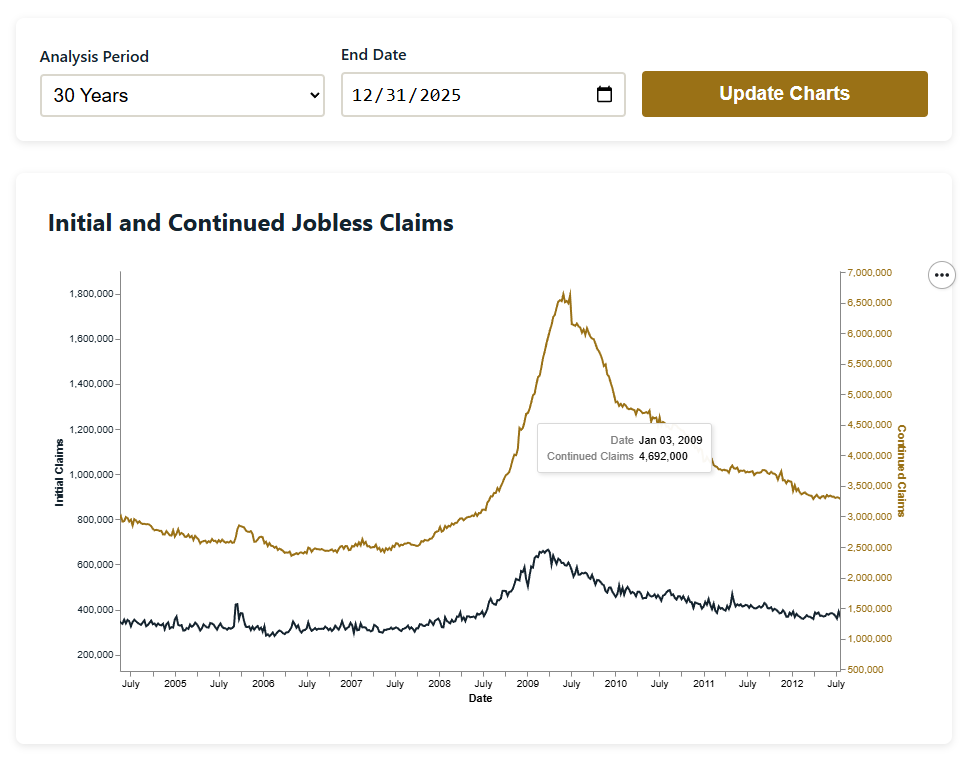
👷♀️ Employment Analysis
Track jobless claims and unemployment data to assess macroeconomic trends over time and the impact they have on the fixed income and equities markets. Dynamically adjust risk in your portfolio based on economic activity.
- Look at historical intial and continued jobless claims
- Track unemployment rates
- Track average length of unemployment
- Track unemployment rates based on age, gender, or race
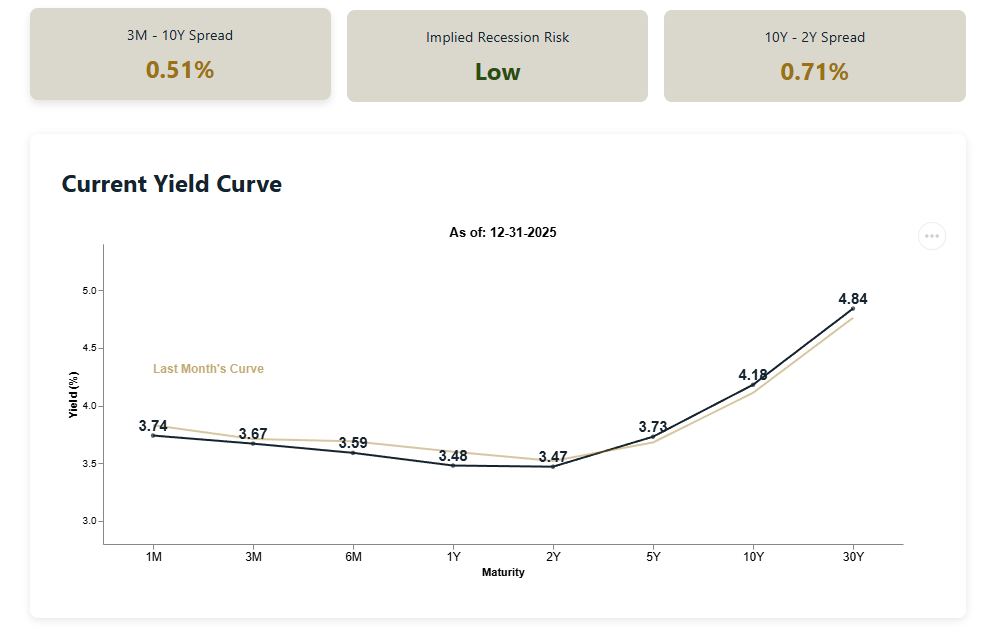
📈 Treasury Yield Curves
Analyze current and historical Treasury yield curves to understand market expectations for future interest rates. Our interactive visualizations allow you to explore term structures and track spreads over time.
- Historical yield data from 1-month to 30-year maturities
- Interactive spread analysis (10Y-2Y, 3M-10Y)
- Yield curve inversion detection
- Custom date range selection
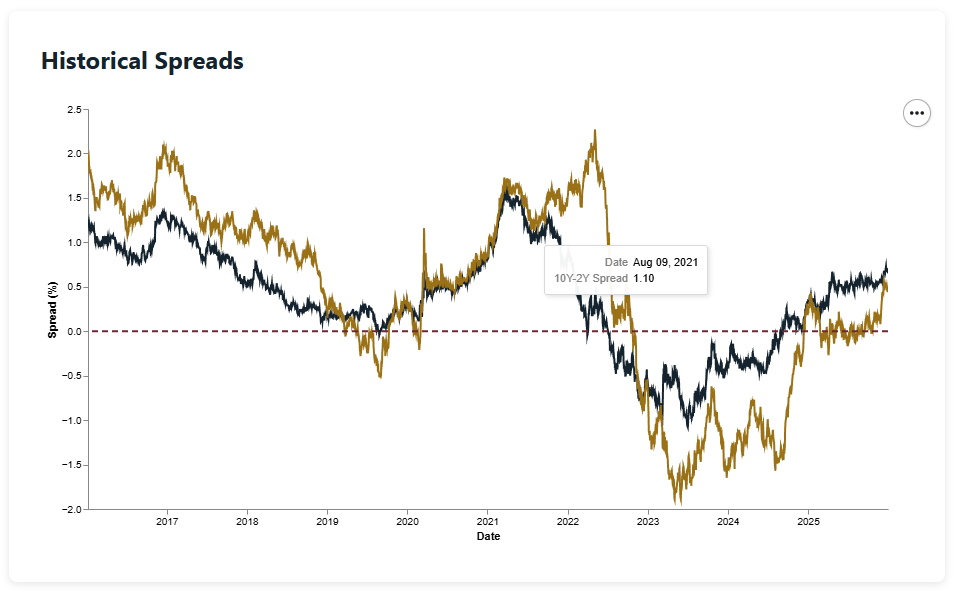
📏 Yield Spread Analysis
Track yield spreads between common maturities to assess the implied recession risk in the short term. Look at how historical spreads have correlated with economic downturns and use this information to inform your investment strategy.
- Look at historical yields of individual maturities
- Look at historical windows from 1W to 10Y
- Get notified of implied recession risk
- See two of the most analyzed yield spreads visually
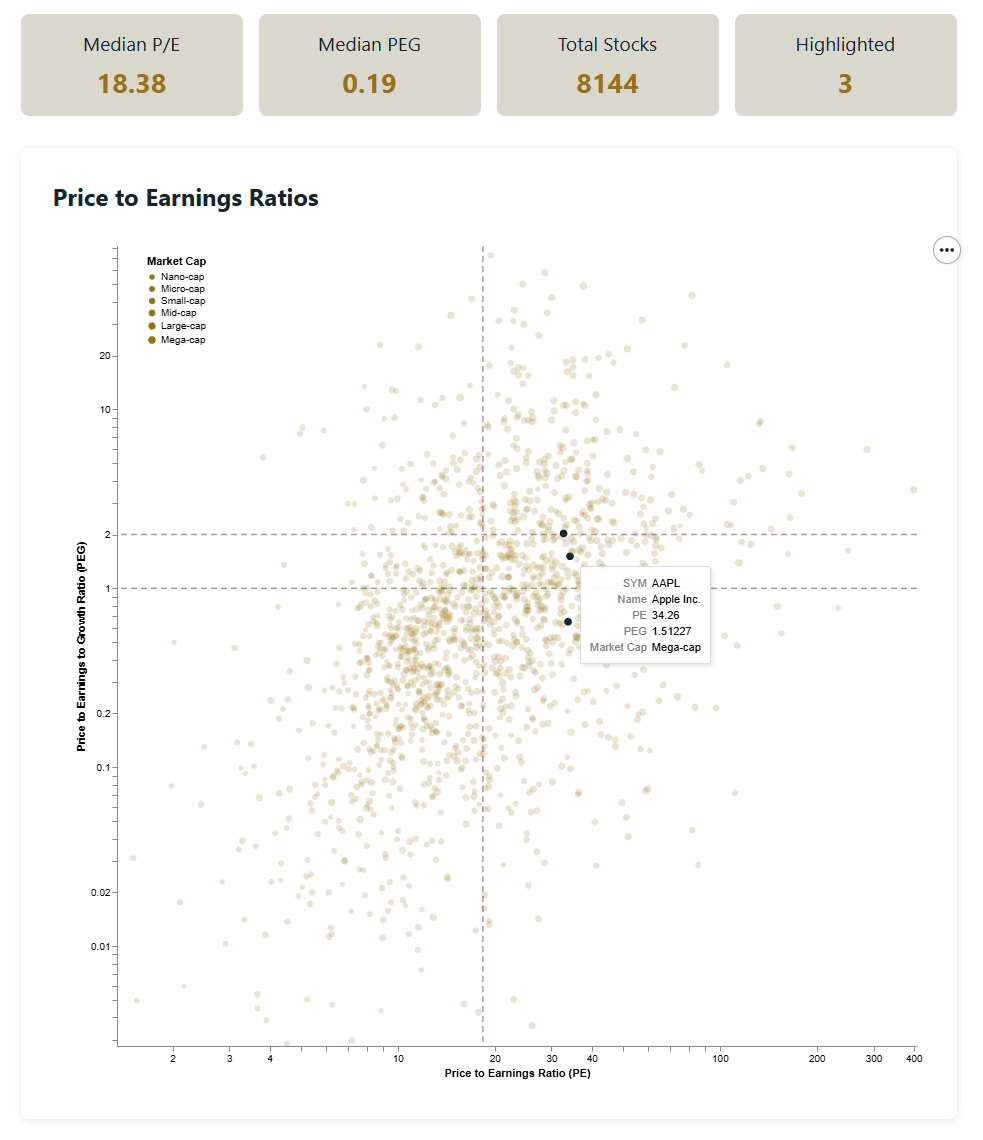
💵 Valuation Metrics
Identify potential investment opportunities by analyzing comprehensive valuation metrics across public companies. Filter by sector and compare against industry benchmarks to find undervalued stocks.
- P/E and PEG ratio analysis with sector medians
- Price-to-Revenue and Price-to-Cash-Flow metrics
- Interactive scatter plots for visual comparison
- Highlight specific stocks for tracking
Ready to Get Started?
Explore our research dashboards covering the economic, fixed income, and equity market data River Rose Financial follows.